DATA ANALYST PORTFOLIO
Project 3
Team Marvel or Team DC? || SQL + Power BI
Remember the first time we laid eyes on Superman? That moment was like discovering a whole new universe. The sheer awe of seeing someone fly in that iconic cape, sparked a sense of wonder that's hard to put into words. Batman, with his epic car, and Iron Man, with his genius charm and suit, imprinting themselves on our hearts. The anticipation, the trailers, the speculations – it was an event! We weren't just watching a movie; we were witnessing a piece of our childhood dreams come to life. And let's not forget the Avengers, the assembly of our favorite heroes in one epic saga. That was a cinematic moment that left us breathless.
So, whether you're Team Marvel or Team DC, let's celebrate the magic of storytelling, the thrill of epic battles, and the power of SQL and Power BI in unraveling the mysteries of our beloved cinematic universes.
But how this fits in your puzzle?
Businesses, much like superheroes, strive to dominate their market and leave a lasting impact. But unlike comic book heroes, real-world success requires data-driven insights and a deep understanding of your audience. This is where I come in!
Market Domination:
Ever wonder who wins the box office war, Marvel or DC? Companies do too! I can help you analyze competitors, spot trends, and find ways to grab the popcorn crown.Customer Whisperer:
Companies want to know their customers inside and out, like reading minds. I can segment audiences based on interests and habits, so businesses can speak their language and offer products they'll actually use (no kryptonite capes, I promise!).Performance Optimization:
Businesses track success like Hawkeye tracks arrows. I can analyze campaigns and products, show them what's working (and what's not!), and help them level up their game.Data Storytelling Sorcerer:
Companies have tons of data, but sometimes it's just gibberish. I can transform it into stunning visuals and clear stories, so everyone understands the insights and makes informed decisions (no need for mind control!).
Let's continue this journey!
Objective
The primary goal was to employ SQL to clean, transform, and analyze a dataset, bringing forth insights into the Marvel and DC cinematic universes. The adventure included data cleanup, table creation, and a series of SQL queries to answer burning questions about our beloved superheroes. Additionally, to enhance the visualization and accessibility of these insights, created a dashboard using Power BI.
Chapter 1: Data Cleanup and Transformation
First things first, I sorted and cleaned up the data, fixed column orders, removed unnecessary data, and split genres into neat little categories using the "Text to Columns" superpower in Excel. Additionally, I converted "IMDb gross" into millions, because, well, we're dealing with blockbuster numbers here!
Chapter 2: SQL Assemble!
Using SQL, I created tables and imported data using the mighty CREATE and COPY commands. Then, I went on a quest to answer some burning questions using a variety of SQL tools – SELECT, aggregate functions, UNION ALL, JOIN, subqueries, GROUP BY, ORDER BY, LIMIT, WHERE, IN, and HAVING. Phew! That's a lot of SQL muscles!
Chapter 3: Power BI in Action!
-
Enhanced User Interaction:
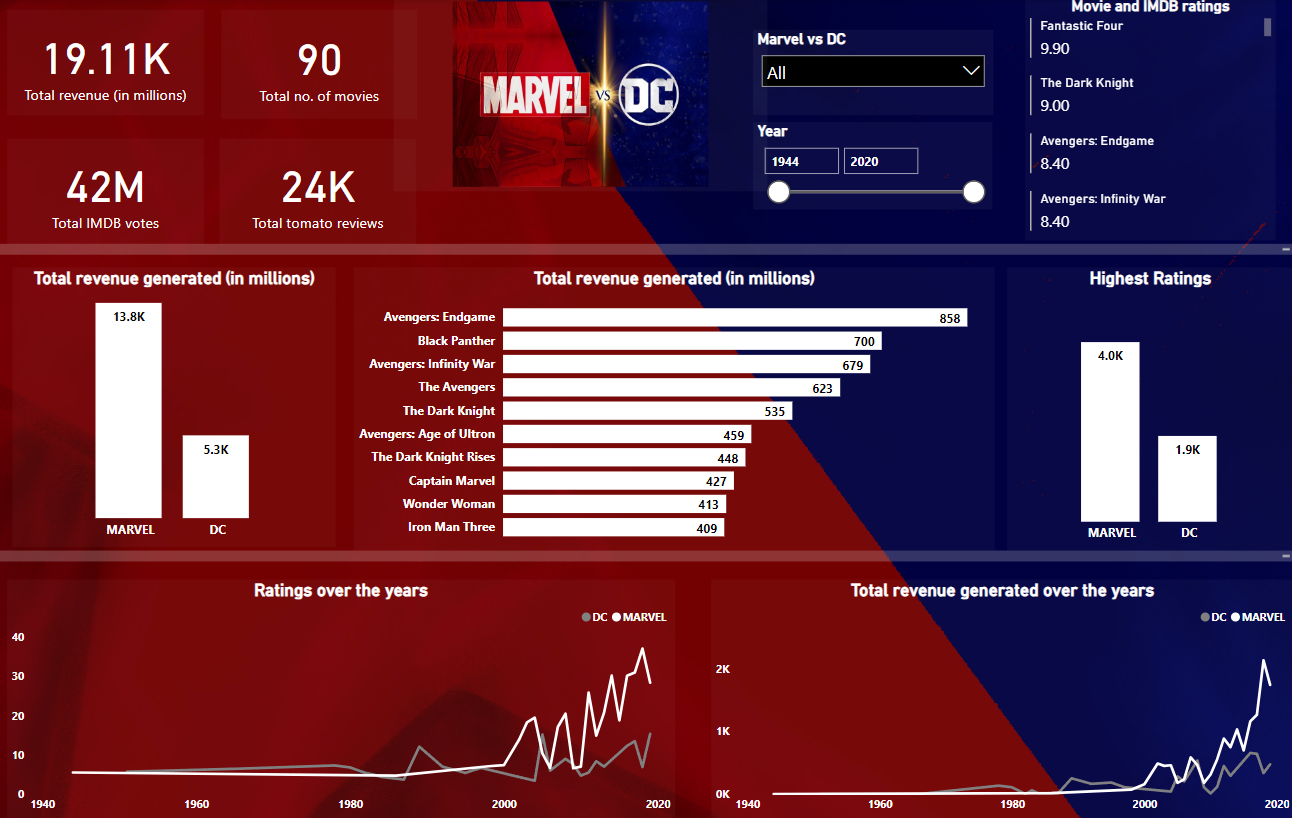
Implemented slicers for easy data filtering by year and entity (Marvel or DC)
-
Multiple KPI Display:
Designed the dashboard to showcase multiple KPIs simultaneously, allowing users to compare key metrics across Marvel and DC for a holistic understanding of their cinematic performance.
-
Time-Based Analysis with Line Charts:
Utilized line charts to illustrate trends in revenue and ratings over the years, offering insights into the evolving dynamics of audience reception and box office success.
-
Total Revenue by Movie:
Introduced a detailed breakdown displaying the total revenue generated by each movie, providing a granular view of the individual impact of superhero films.
-
Marvel vs. DC Revenue Comparison:
Implemented a visual representation comparing the total revenue generated by Marvel and DC, offering a clear answer to the question of which superhero universe was the box office champion.
Key Insights:
- Marvel's revenue dwarfs DC's, reaching an astounding 13.8 billion compared to DC's still-impressive 5.3 billion.
- Fantastic Four leads the rating charts with an outstanding 9.9 on IMDb, surpassing The Dark Knight's 9.
- Avengers: Endgame claims the box office throne with a staggering 858 million, closely followed by Black Panther at 700 million. DC's standout performer is The Dark Knight with 535 million.
- In the battle of ratings, Avengers: Endgame and Avengers: Infinity War secure Marvel's highest revenue but fall behind in ratings with 8.4.
- Trend analysis showcases Marvel's dominance post-2000, asserting its supremacy over DC in both revenue and ratings.
- A surprising revelation is that a mere 90 movies collectively pulled in a remarkable 19.11 billion, emphasizing the immense impact of superhero sagas on the box office.
