Project-5
Call Center Diversity Pulse: Insights Through Data || PowerBI

In the bustling world of call centers, where customer connections unfold like a well-scripted drama, diversity takes center stage. Recognizing the pivotal role diversity plays in organizational success, I embarked on a Power BI journey to dissect the intricacies of a call center's workforce.
Project Objective:
In a call center symphony, where voices blend into a harmonious melody of customer service, the objective was clear – unravel the diversity tapestry. By leveraging Power BI's prowess, the project aimed to spotlight key insights that could orchestrate strategic decisions, fostering a more inclusive workplace.
Key Concepts and Results:
-
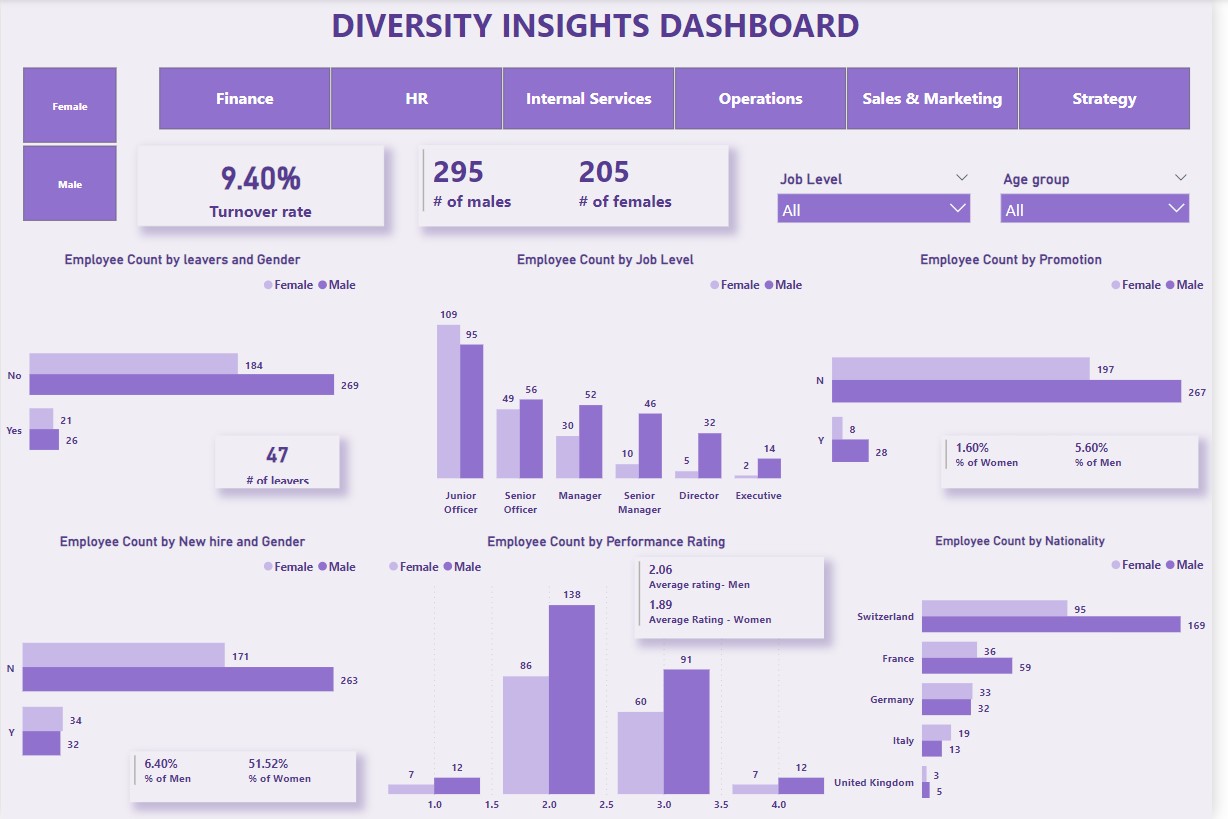
Diversity Slicers:
Gender and Department Slicers: Like finely tuned instruments, gender and department slicers allowed for a nuanced exploration of workforce distribution.
Job Level and Age Group Slicers: Dropdown slicers harmonized the exploration of job levels and age groups, revealing the diverse composition of the call center ensemble. -
Measures:
Turnover Rate: Unveiling the rhythm of attrition, the turnover rate measure provided a beat for understanding employee departures.
Gender-Based Metrics: From male-female ratios to promotion distributions, these metrics composed a symphony of insights into workforce dynamics. -
Employee Counts by Gender:
Bar Graph for Leavers: A gender-themed crescendo exposed the exit dynamics, hinting at a subtle gender melody.
Bar Graph for New Hires: A contrasting gender overture for new hires signaled a changing tune in the call center ensemble. -
Employee Counts by Job Level:
Column Graph: A visual composition of job levels unraveled the dominance of certain notes, particularly the deep resonance of men at the junior officer level.
-
Employee Counts by Performance Rating:
Column Graph: Each column told a story of performance ratings, with a consistent melody – men holding a higher note.
-
Employee Counts by Promotion:
Bar Graph: A crescendo of promotions, yet a gender gap echoed through the bar graph, urging a harmonious balance.
-
Employee Nationality:
Bar Graph: A symphony of nationalities, with a notable emphasis on Switzerland, yet with a gender beat that begged for an inclusive remix.
Conclusion:
This Power BI project doesn't just analyze data; it orchestrates a melody of diversity and inclusion in the call center. The insights spotlight gender disparities, creating a musical score that calls for change. By weaving together Power BI's capabilities, this project equips decision-makers with the tools to conduct a symphony of positive change, fostering a workplace where every voice is not just heard but celebrated.