Project-6
Brewing Success: Interactive Coffee Sales Analysis || Microsoft Excel

In a world where coffee is not just a beverage but a sip of soulful inspiration, I found myself pondering over the profound question - what secrets could our coffee sales data hold? Armed with Excel as my trusty barista, I embarked on a journey to decode the nuances of our coffee sales dataset sourced from Kaggle.
Objective:
The mission- transform raw data beans into a robust blend of insights. With tables detailing orders, customers, and products, the goal was to craft an aromatic narrative that unfolds the story behind our coffee sales.
Introduction:
Picture three tables – Orders, Customers, and Products, each holding a unique piece of the coffee puzzle. This project, a delightful sip into data analysis, revolves around unraveling the mysteries behind our coffee sales data, turning mundane numbers into a rich and invigorating brew of insights.
Key Concepts and Techniques:
-
Data Cleaning - Rinsing Off the Grind:
Like rinsing coffee grounds from a French press, data cleaning ensured a smooth brew. Handling missing values, chasing away duplicates, and adjusting column vibes set the stage for a flawless analysis.
-
Data Retrieval and Transformation - Blending the Beans:
Think of the Order table as our coffee concentrate. Using Excel's enchanting functions – XLOOKUP, IF, INDEX, MATCH – we enriched this brew with customer and product aromas, transforming it into a delightful concoction.
-
Pivot Tables - A Sip of Summarization:
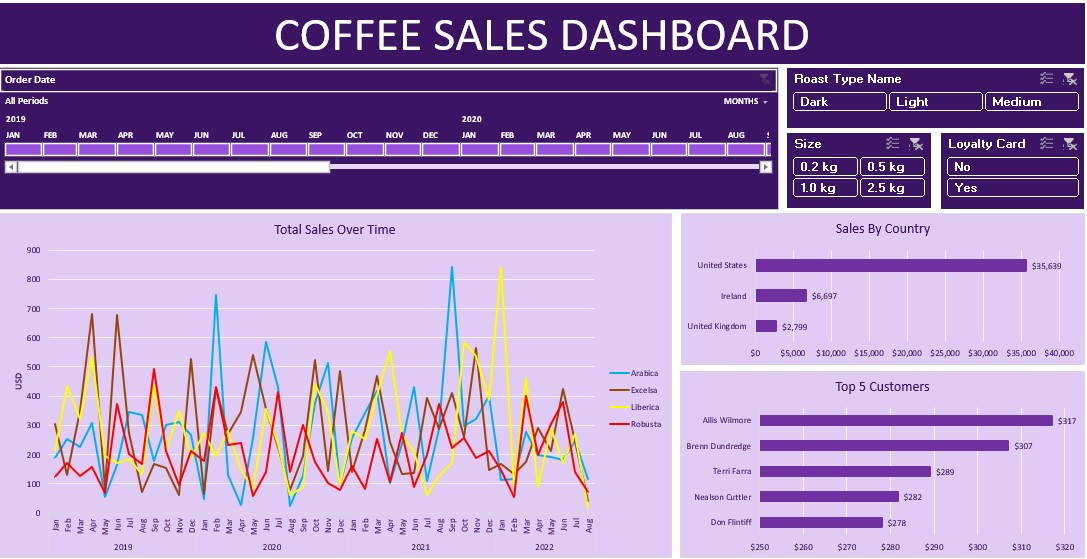
Pivot tables, our data sommeliers, summarized and aggregated information. They unveiled the top 5 customers, showcased total sales trends, and even spilled the beans on sales by country.
-
Data Visualization - Brewing a Visual Symphony:
Line charts danced with total sales over time, bar charts painted landscapes of sales by country and top customers. Slicers and timelines added a dash of interactivity, making the exploration as delightful as choosing from a menu.
-
Interactive Dashboard - The Barista's Showcase:
All elements combined to craft an interactive dashboard, a coffee store's dream. Monitoring sales trends, gaining insights into customer preferences, analyzing geographical nuances, and optimizing the product lineup – all in one sip.
Key Insights:
-
Unveiling sales trends over time to plan inventory and promotions.
-
Spotlight on the top customers, paving the way for personalized marketing.
-
Geographic insights for strategic expansion and targeted marketing.
-
Leveraging product data to fine-tune our coffee repertoire.
In this caffeinated adventure, the project transformed from a simple data analysis task into a flavorful journey, revealing the untold stories hidden within the beans. With Excel as my brewmaster, I sipped through the complexities, crafting a blend of insights that not only quenches curiosity but fuels strategic decisions for our coffee haven.